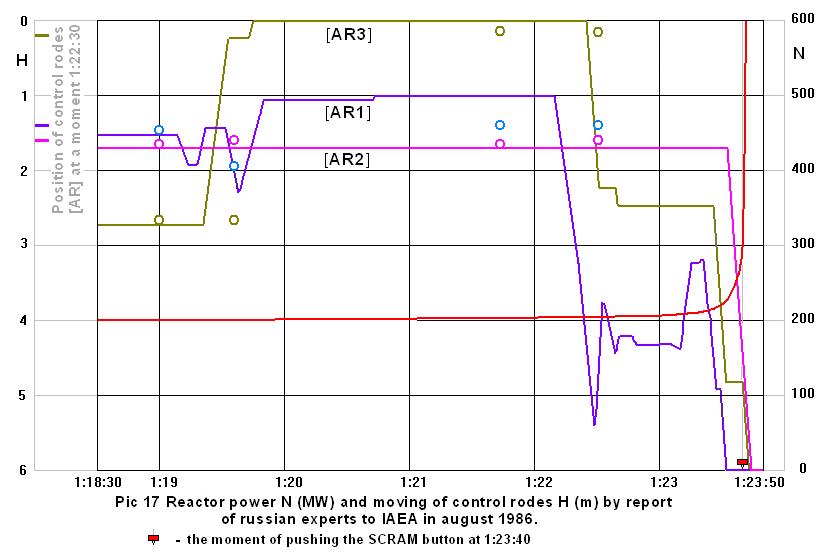
Well, the power presented on Pic. 17 since the moment of pushing of SCRAM button is obviously the result of mathematical simulation. But what is it up until that time? Whence the power is taken?
Here again it is necessary to tell about one fact ignored in the report. On reactor RBMK the power (more exact the neutrons flux to which it is proportional) is measured in two various independent ways: integration of indications of sensors of inner control system (PPDDCS) and under indications by external ionization chambers (SIC). At normal work of the reactor when the distribution of power allocation (a neutron flux) across the reactor core is steady also reactor power is stable and sufficiently great, both monitoring systems show same. But in transitive modes (because of large inertia of sensors) and on low power (because of sensitivity of sensors to gamma-radiation) the power measured on PPDDCS, is doubtful and differs from indications of SIC.
The operator, operating the reactor by hand, and automatic control system ([AR]) support the power under indications of SIC. And the power of reactor under these indications did not vary up to SCRAM button pushing, but after pushing has catastrophically increased (see. Pic 2). But the power under PPDDCS slightly increased last 5-10 minutes before SCRAM button pushing.
And so the trick is that it is not told about which power there is a speech, obviously so that it gives possibility to mean any of two, just which will be necessary in other context as though between them there is no difference.
But even irrespective of the fact which power is represented, it did not have such fast increase before pressing the SCRAM button as it is shown in the picture.
The lineage of diagramme of the rodes [AR] moving is not less mysterious. It cannot be result of modelling, nobody had such models. The lineage of diagram of the rods [AR] moving is not less mysterious. It cannot be result of simulation, nobody had such models. Diagrams of recording devices only could be a unique source of the data, this data were not registered anywhere else. But at tapes driving speed of 60 mm/h it is necessary to have very great power of imagination to represent such picture as Pict.17.
back to FAQ
|